Was Gretzky Really THAT Great?
(I used to genuinely question Gretzky’s greatness and the data helped me make my decision)
A unique approach to evaluate NHL players by accounting for era effects

Introduction
Thank you for visiting my blog!
Let’s get right into this blog as there isn’t a whole to be said in the introduction other that we are going to build an exciting and unique analysis of every NHL player from every NHL season (up until 2018-19).
Project Goal
A while back, I set out to develop a system to evaluate NHL and NBA players (like every one ever to play a second at the professional level) and see how they measure against their peers. I worked on data engineering and creating a database as well designing an optimal way to evaluate players. For today’s blog, I’m going to share part of that project with you in an interactive and visual-driven way. I have created a Tableau public project that will allow me share some insights with you, the reader, in a way driven by you, the reader. My project allows users to pick their own filters and ways to view my data. All you need to know for now is this: when you see that a good player’s goal statistic is, I don’t know, like 3.513, it means that the player in question was 3.513 times better than league average in goals that year. If the average NHL player scores 5.5 goals per year, the player in question probably scored ~19 goals. It doesn’t sound like a lot of goals to score in an 82-game season to the casual fan, but it’s actually not that bad. Just keep in mind while you view my project that some stats were not recorded until more recent years. If you look up how many hits Maurice Richard or Eddie Shore had in any season of their careers, you will likely find no information. To see different pages from the various visuals, scroll down to where it says “Metadata” and click on different sheets. Also, as you adjust your filter preferences, keep in mind that you do not want to overload the system. So looking for every name of every player to play in the 2006 season, for example, is a lot more annoying than looking at every Blackhawks player in 2006 or every player who had at least 4 times the league average of goals in 2006. I really like the system of comparing actual stats to averages because it allows you to understand everything in context. If someone scores 200 goals in a season, for example, you may assume he’s better than any current player as no one has even come close to 70 goals in recent years (most goals ever in a season is 92 I think – so this obviously just a test-case). However, if the season in question saw almost every player reach at least 8000 goals (again, just a test-case), than the player with 200 goals kind of sucks. With relative scores, we don’t have this problem. It’s similar to feature scaling in data science ($100 is a lot to pay for a candy bar but rather cheap for a functional yacht). My system is susceptible to the occasional glitch, especially if a player was traded late in the season, but overall works quite well.
The Gretzky Question
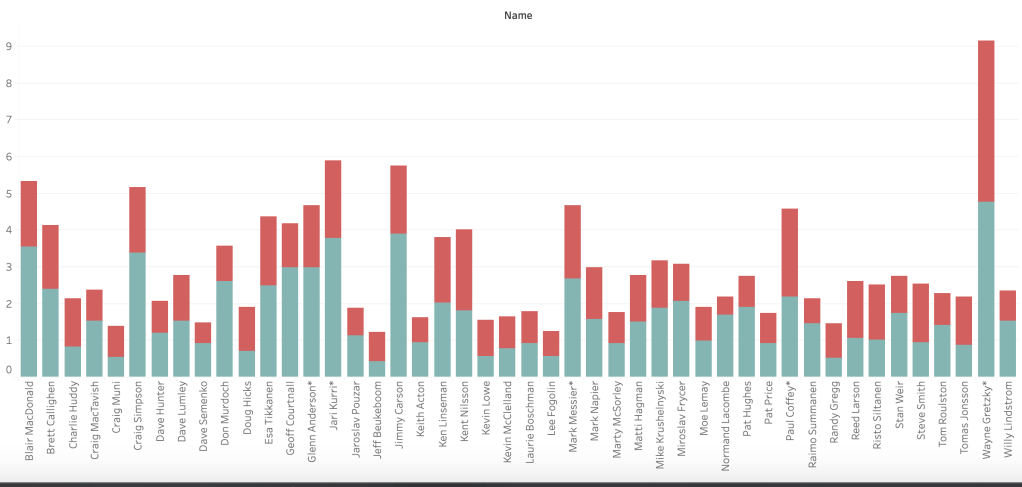
To follow up on my comment earlier about Gretzky, I’d like to share one visual users can navigate to in my project on their own if they go to the “Player Goal Assists” tab and filter for Edmonton Oiler stats from 1980 to 1989 and only include players who averaged at least the league average in goals and assists across those 10 seasons. The red bars indicate how much better one player was compared to the league in assists and the teal represents goals. If you know hockey, you see guys like Jari Kurri, Mark Messier, and Paul Coffey, who are all superstars. Paul Coffey is actually one of my favorite all time players (and favorite defensemen) in the pool of players-I-never-saw-play. However, none of the players mentioned above (all hall of famers who have each one at least one individual trophy and have also each won multiple Stanley Cups) compare to Wayne Gretzky (second from end right). So, yeah, he was pretty darn good even after accounting for era effects and taking into account his superstar teammates.
Link
So now that I have talked about the project and how to navigate your way around it, here comes the link…
But first… keep in mind that you guide this project using the interactive filters on the right hand side of the page – use those filters!
https://public.tableau.com/profile/joseph.cohen2401#!/vizhome/relative_hockey/Sheet0
Conclusion
Tableau is great! I only know the basics, though, and am still getting my feet wet. I definitely see the possibility of updating the Tableau project linked above and diving deeper into more interesting and exciting visualizations. If you, the reader, liked my data visualization system, I recommend you also learn some of the Tableau basics as its a fairly simple software. I hope you found some interesting stats and stories in today’s inquiry.
Thanks for Reading!

