Determining power in hypothesis testing for confidence in test results

Introduction
Thanks for visiting my blog.
Today’s post concerns power in statistical tests. Power, simply put, is a metric of how reliable a statistical test. One of the inputs we will see later on pertains to effect size, which I have a previous blog on. Power is usually a metric one calculates before performing a test. The reason we do this is because low statistical power may nullify test results. Therefore, we can save time and skip all the effort required to perform a test if we know our power is low.
What actually is power?
The idea of what power is and how we calculate power is relatively straight-forward. The mathematical concepts, on the other hand, are a little more complicated. In statistics we have two important types of errors; type 1 and type 2. Type 1 error corresponds to a case of rejecting the null hypothesis when it is in fact true. In other words, we assume input has effect on output when it actually does not. The significance level in a test, alpha, corresponds to type 1 error and represents the probability of type 1 error. As we increase alpha, we may see a higher probability of rejecting the null hypothesis, but our probability of type 1 error increases. Type 2 error is the other side of the coin; we don’t reject the null hypothesis when it is in fact false. Type error is linked to statistical power in that power, as a percentage, can be characterized as the complement of type 2 error probability. In other words, it is the probability that we reject the null hypothesis given that it is false. If we have a high probability that we made the correct prediction, we can enter a statistical test with confidence.
What does this all look like in the context of an actual project?
We know why power matters and what it actually is statistically. Now that we know all this, it’s time to see statistical power in action. We’ll use python to look at some data, propose a hypothesis, find the effect size, solve for statistical power, and run the hypothesis. My data comes from kaggle (https://www.kaggle.com/datasnaek/chess) and concerns chess matches.
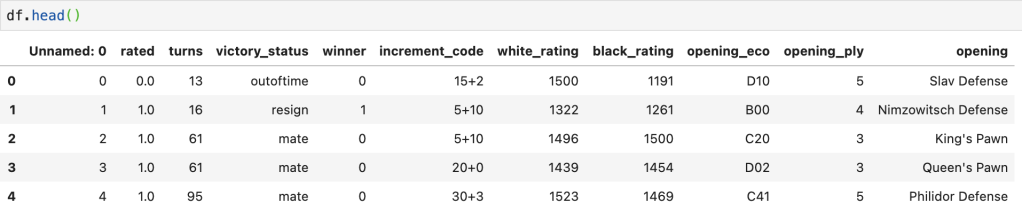
Here’s a preview of the data:
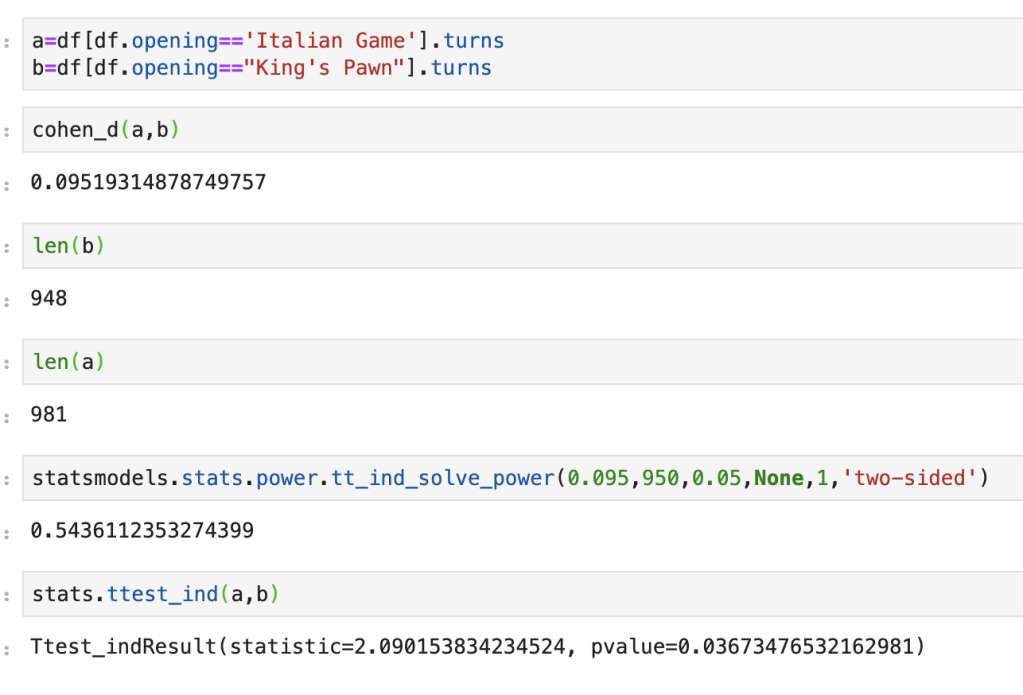
My question is as follows: do games that follow the King’s Pawn process take about as long as games that follow the Italian Game process. Side note: I have no idea what an Italian Game is, or most of the openings listed in the data. We start by looking at effect size. It’s about 0.095, which is pretty low. Next we input the data of turn length from Italian Game processes and King’s Pawn processes. Implicit in this data is everything we need; size, standard deviation, and mean. If we set alpha to 5%, we get a statistical power slightly above 50%. Not great. Running a two-sample-t-test leads to a 3.67% p-value which tells us that these two openings lead to games of differing lengths. The problem is power is low, so it wasn’t quite worth running these tests. And that… is statistical power in action.
Conclusion
Statistical power is important as it can modify how we look at hypothesis tests. If we don’t take a look at power, we may be led to the wrong conclusions. Conversely, when we believe to be witnessing something interesting or unexpected, we can use power to enforce our beliefs.