Understanding the use of z scores in performing statistical inquiries
Introduction
Thanks for visiting my blog today!
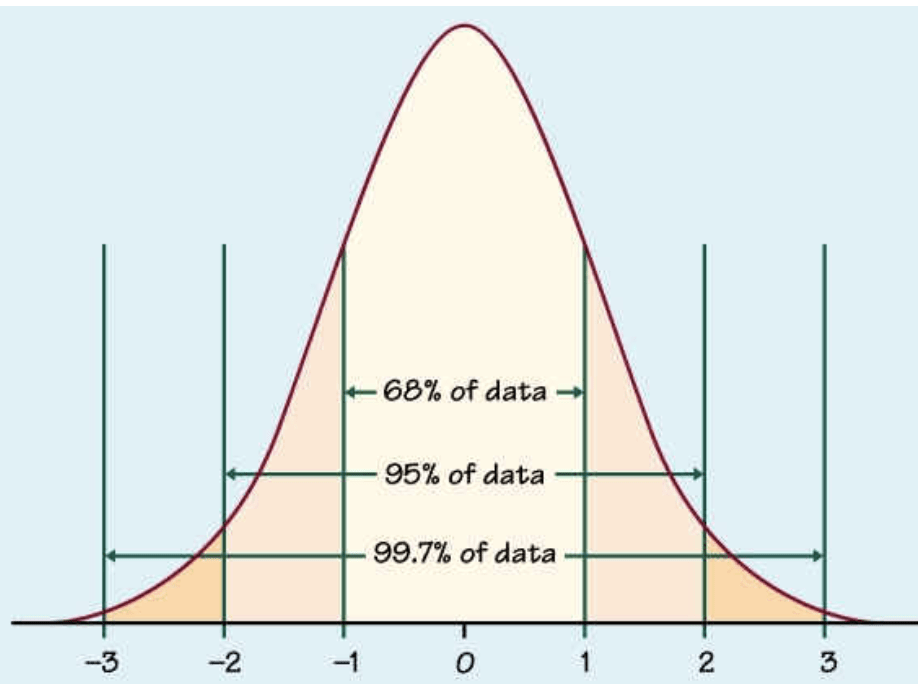
Today’s blog concerns hypothesis testing and the use of z scores to answer questions. We’ll talk about what a z score is, when it needs to be used, and how to interpret the results from a z score-related analysis. While you may or may not be familiar with the term z score, you are very likely to have encountered the normal distribution / bell curve depicted above. I tend to think almost everything in life, like literally everything, is governed by the normal distribution. It’s got a low amount of mass toward the “negative” end, a lot of mass in the middle, and another low amount of mass toward the “positive” side. So if we were to poll a sample of a population on any statistic, say athletic ability, we will find some insane athletes like Michael Phelps or Zach Lavine, some people who are not athletic at all, and everyone else will probably fall into the vast “middle.” Think about anything in life, and you will see the same distribution applies to a whole host of statistics. The fact that this normal / bell-curve is so common and natural to human beings means that people get comfortable using it when trying to answer statistical questions. The main idea of a z score is to see where an observation of data (say IQ of 200, I think that’s a high IQ) falls on the bell curve. If it falls smack in the middle, you are probably not an outlier. On the other hand, if you’re IQ is so high that there is almost no mass at the area of that IQ, we can assume you’re pretty smart. Z scores create a demarkation point that allows us to make use the normal distribution.
When do we even need the z score test in the first place?
We use the z score to see how much a sample from a population represents an outlier. We will need to also use a threshold to decide at what point we call an observation a significant outlier. In hypothesis testing, “alpha” refers to the threshold where we decide whether something is an extreme outlier or not. Often, alpha will be 5%. This means that if the probability of something not being an outlier is 5% or lower, we can assume it is a true outlier. On the standard normal distribution graph (mean zero, standard deviation 1), 5% usually corresponds to 1.96 standard deviations away from the mean of zero. This means if our z score is greater than 1.645 or less than -1.645, we are witnessing a strong outlier. If we have two outliers, we can look at their respective z score to see which outlier is more extreme.
How do we calculate a z score?
It’s actually pretty simple. A z score is equal to the particular observation minus the population mean. That value just described above is then divided by the standard deviation of the population.
Example: if we have a distribution with mean 10 and standard deviation 3, is an observation of 5 a strong outlier? 5-10 = -5. -5/3 = -1.67. So at alpha = 5%, this is a strong outlier. If we restricted alpha and decreased it to 2%, 5 is no longer such a strong outlier. So basically 5 is 1.67 standard deviations from the mean and does represent a significant outlier under alpha at 5%.
If we don’t know the full details of an entire population, things change slightly. Assuming we have more than 30 data points in our sample, the equation becomes observation minus sample (not population) mean. That quantity is then first multiplied by the sample size and then divided by the sample standard deviation.

This process also works if we are trying to evaluate a broader trend. If we want to look at 50 points from a set of 2000 points and see if those 50 points are outliers, we take the mean of 50 points and insert that value as our “observation” input.
Ok, so what happens when we have less than 30 data points? I have another blog to explain what happens there currently in the works.
Conclusion
The z score / z statistic element of hypothesis testing is quite elegant due to its simple nature and connection to the rather natural-feeling normal distribution. It’s an easy and effective tool anyone should have at their disposal whenever trying to perform a meaningful statistical inquiry.
Thanks For Reading!