Effectively Predicting the Outcome of a Shark Tank Pitch

Introduction
Thank you for visiting my blog today!
Recently, during my quarantine, I have found myself watching a lot of Shark Tank. In case you are living under a rock, Shark Tank is a thrilling (and often parodied) reality TV show (currently on CNBC) where hopeful entrepreneurs come into the “tank” and face-off against five “sharks.” The sharks are successful entrepreneurs who are basically de-facto venture capitalists looking to invest in the hopeful entrepreneurs mentioned above. It’s called “Shark Tank” and not something a bit less intimidating because things get intense in the tank. Entrepreneurs are “put through the ringer” and forced to prove themselves worthy of investment in every way imaginable while standing up to strong scrutiny from the sharks. Entrepreneurs need to demonstrate that they have a good product, understand how to run a business, understand the economic climate, are a pleasant person to work with, are trustworthy, and the list goes on and on. Plus, contestants are on TV for the whole world to watch and that just adds to the pressure to impress. If one succeeds, and manages to agree on a deal with a shark (usually a shark pays a dollar amount for a percentage equity in an entrepreneur’s business), the rewards are usually quite spectacular and entrepreneurs tend to get quite rich. I like to think of the show, even though I watch it so much, as a nice way for regular folks like myself to feel intelligent and business-savvy for a hot second. Plus, it’s always hilarious to see some of the less traditional business pitches (The “Ionic Ear” did not age well: https://www.youtube.com/watch?v=FTttlgdvouY). That said, I set out to look at the first couple seasons of Shark Tank from a data scientist / statistician’s perspective and build a model to understand whether or not an entrepreneur would succeed or fail during their moment in the tank. Let’s dive in!

Data Collection
To start off, my data comes from kaggle.com and can be found at (https://www.kaggle.com/rahulsathyajit/shark-tank-pitches). My goal was to predict the target feature “deal” which was either a zero representing a failure to agree on a deal or a 1 for a successful pitch. My predictive features were (by name): description, episode, category, entrepreneurs, location, website, askedFor, exchangeForStake, valuation, season, shark1, shark2, shark3, shark4, shark5, episode-season, and Multiple Entrepreneurs. Entrepreneurs meant the name of the person pitching a new business, asked for means how much money was requested, exchange for stake represents percent ownership offered by the entrepreneur, valuation was the implied valuation of the company, shark1-5 is just who was present (so shark1 could be Mark Cuban or Kevin Harrington, for example), and multiple entrepreneurs was a binary of whether or not there were multiple business owners beforehand. I think those are the only features that require explanation. I used dummy variables to identify which sharks were present in each pitch (this is different from the shark1 variable as now it says Mark Cuban, for example, as a column name with either a zero or one assigned depending on whether or not he was on for that episode) and also used dummy variables to identify the category of each pitch. I also created some custom features. Thus, before removing highly correlated features, my features now also included the dummy variables described above, website converted to a true-false variable depending on whether or not one existed, website length, a binned perspective on the amount asked for and valuation, and a numeric label identifying which unique group of sharks sat for each pitch.
EDA (Exploratory Data Analysis)
The main goal of my blog here was to see how strong of a model I could build. However, an exciting part of any data-oriented problem is actually looking at the data and getting comfortable with what it looks like both numerically and visually. This allows one to easily share fun observations, but also provides context on how to think about some features throughout the project. Here are some of my findings:
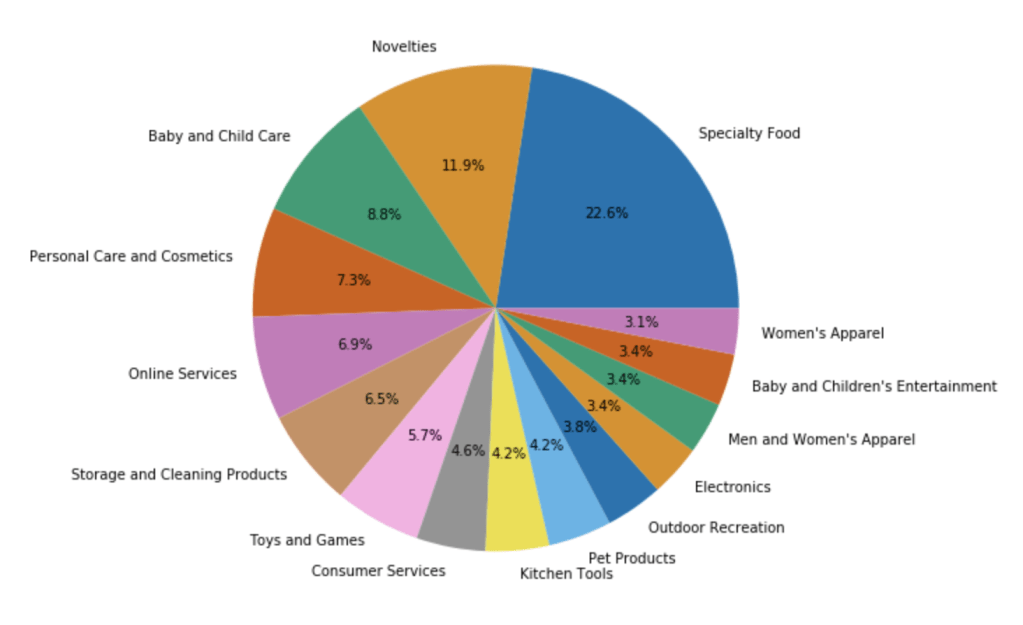
Here is the distribution of the most common pitches (using top 15):
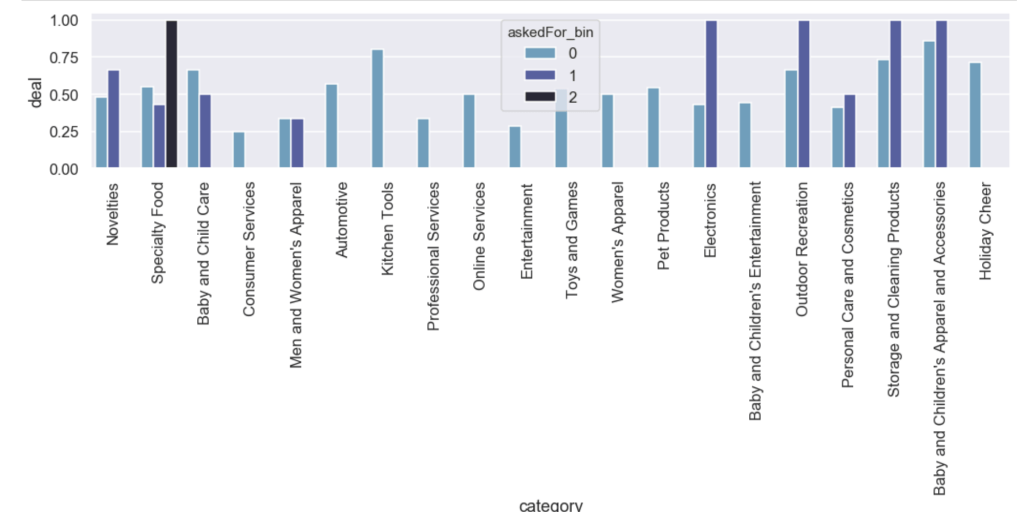
Here is the likelihood of getting a deal by category with an added filter for how much of a stake was asked for:
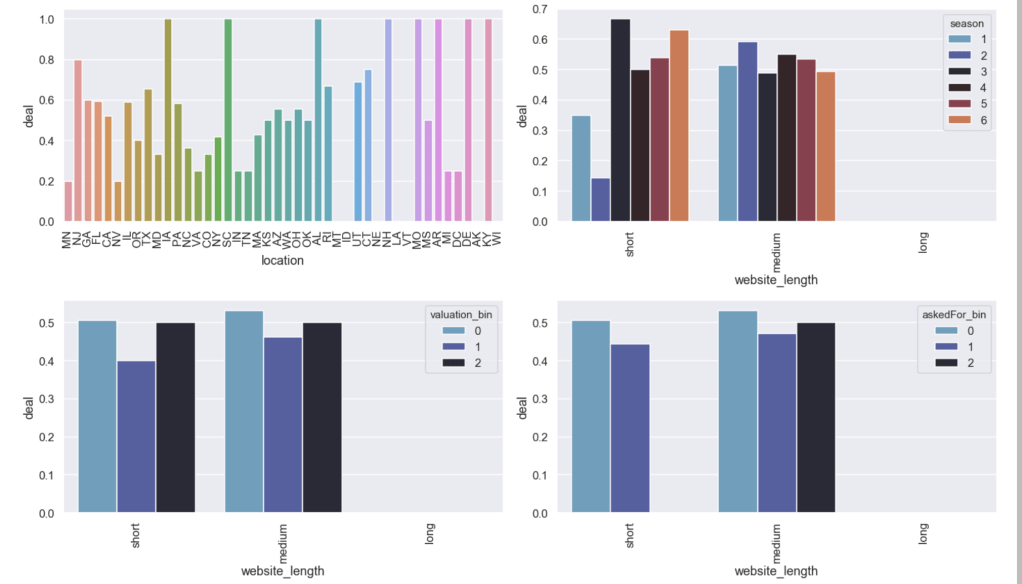
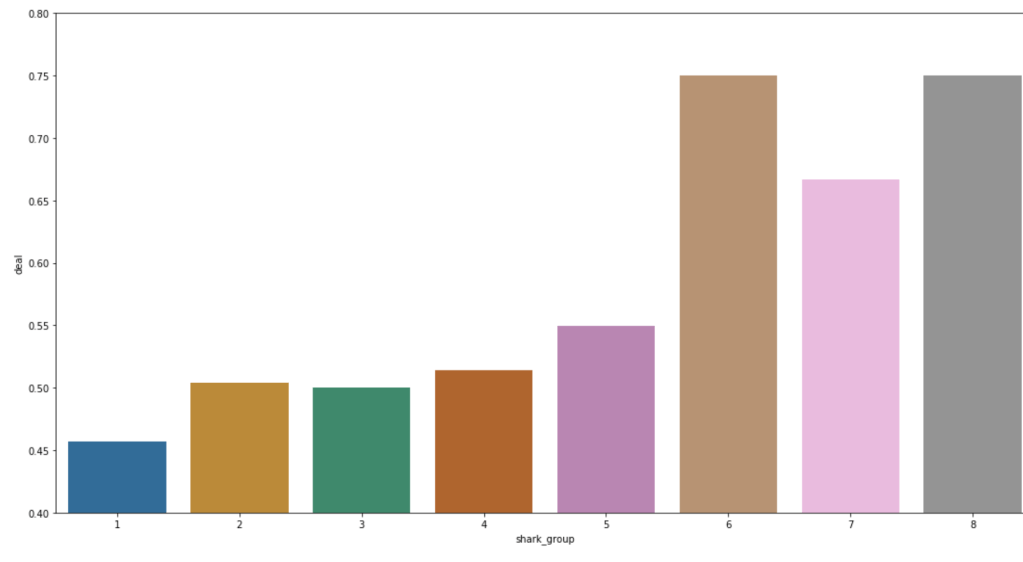
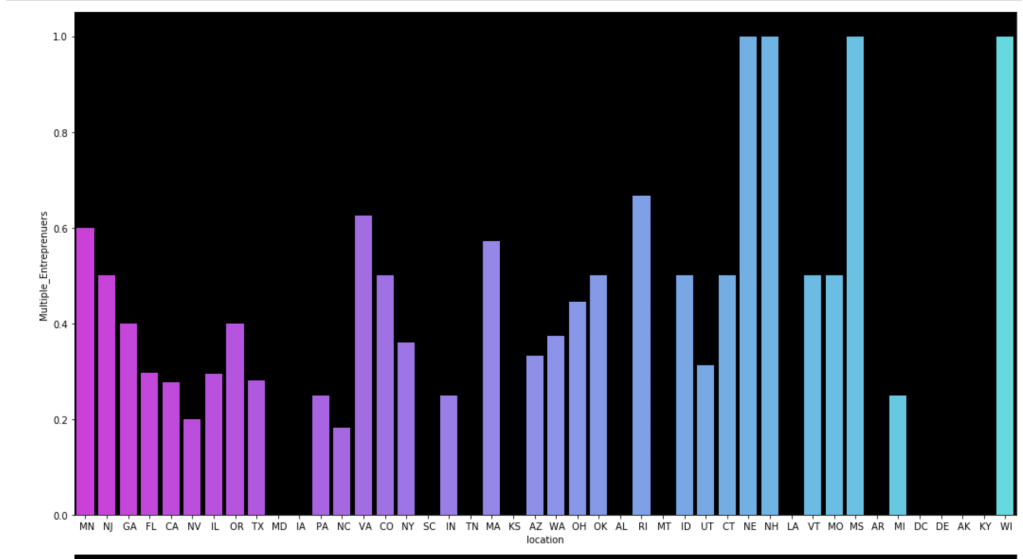
Here are some other relationships with the likelihood of getting a deal:
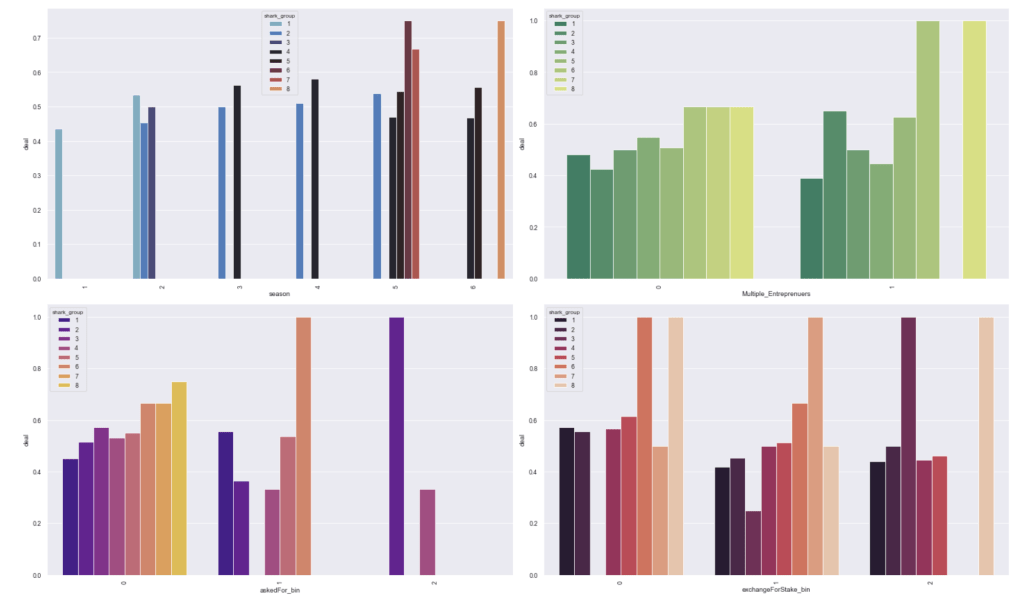
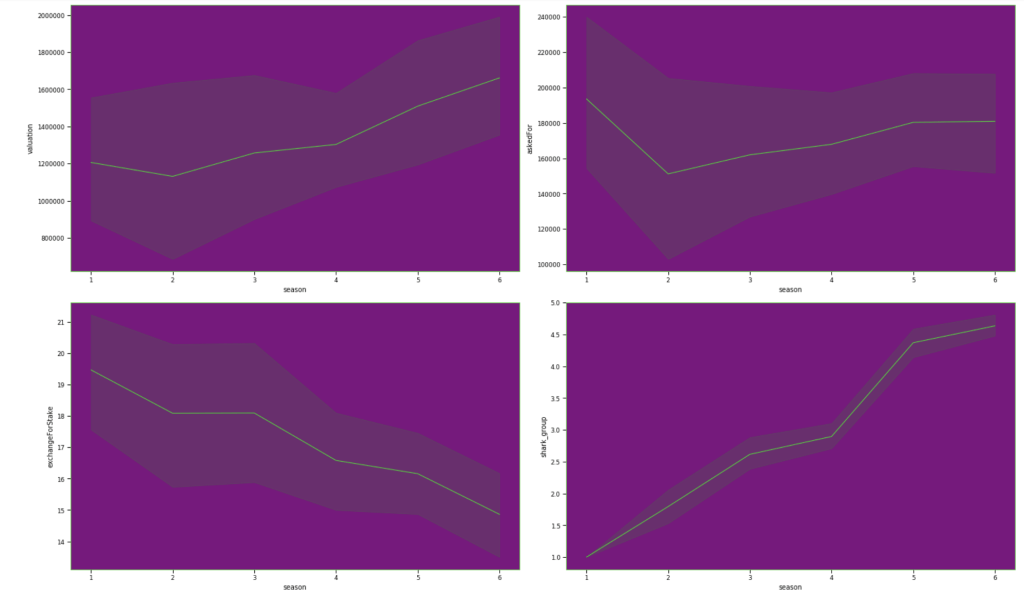
Here are some basic trends from season 1 to season 6:
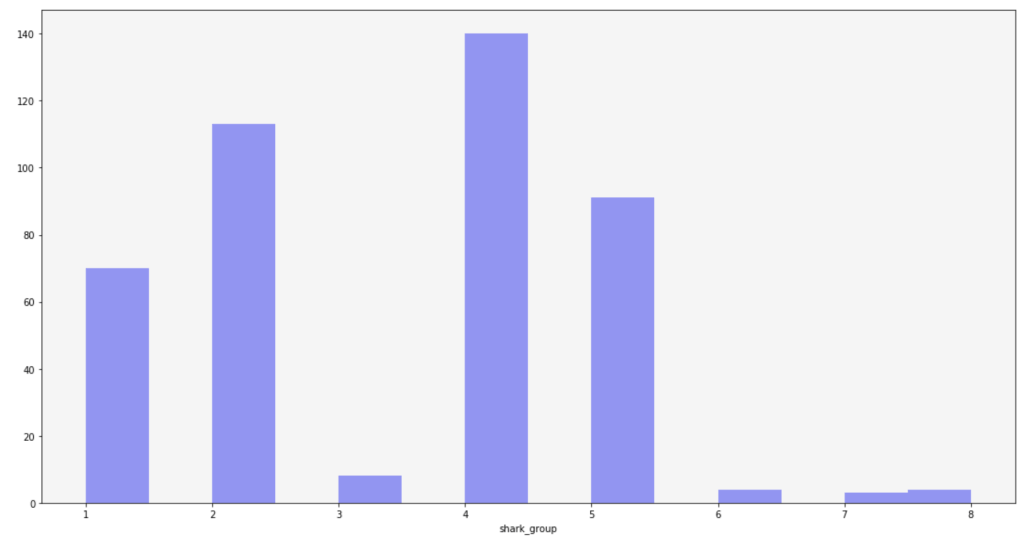
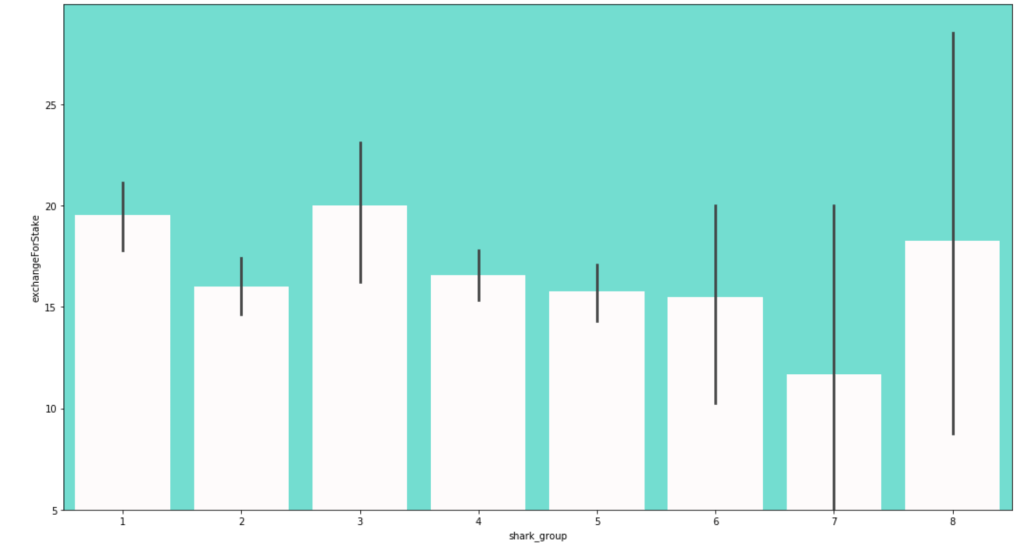
Here is the frequency of each shark group:
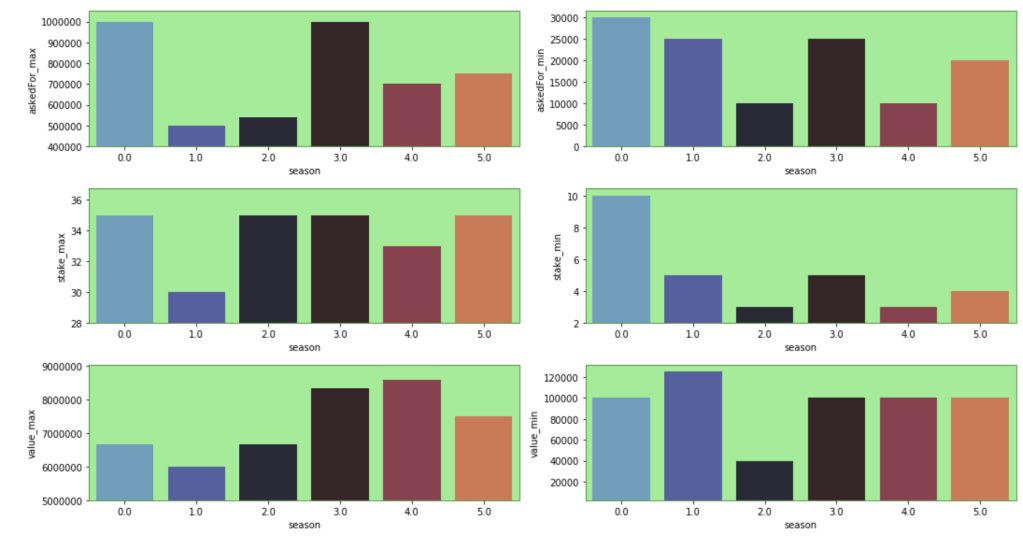
Here are some other trends over the seasons. Keep in mind that the index starts at zero but that relates to season 1:
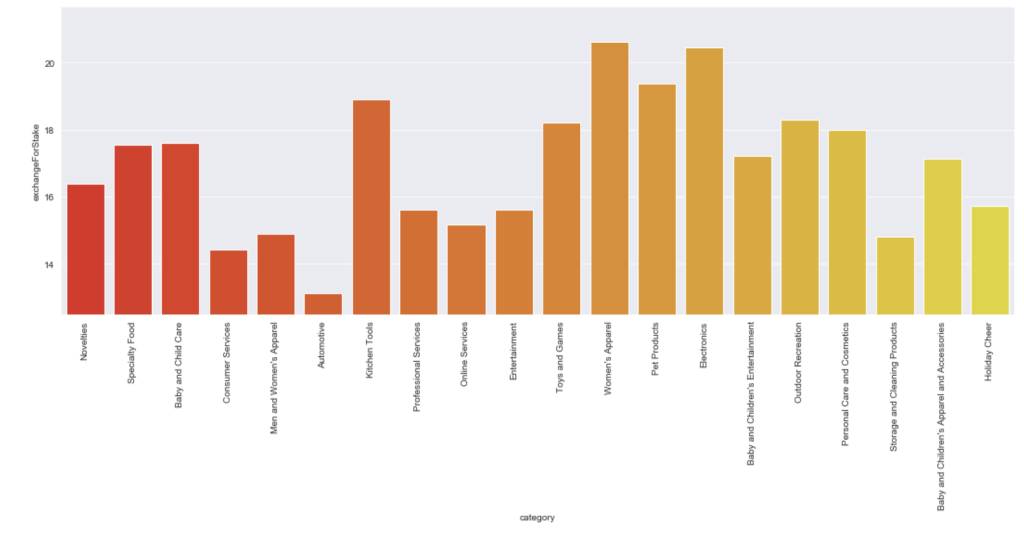
Here is the average stake offered by leading categories:
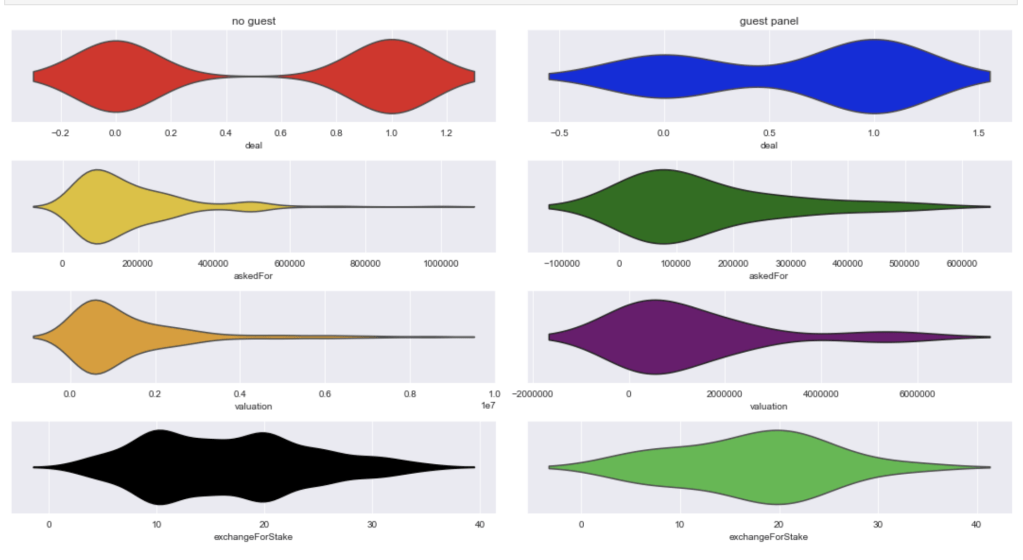
Here comes an interesting breakdown of what happens when there is and is not a guest shark like Richard Branson:
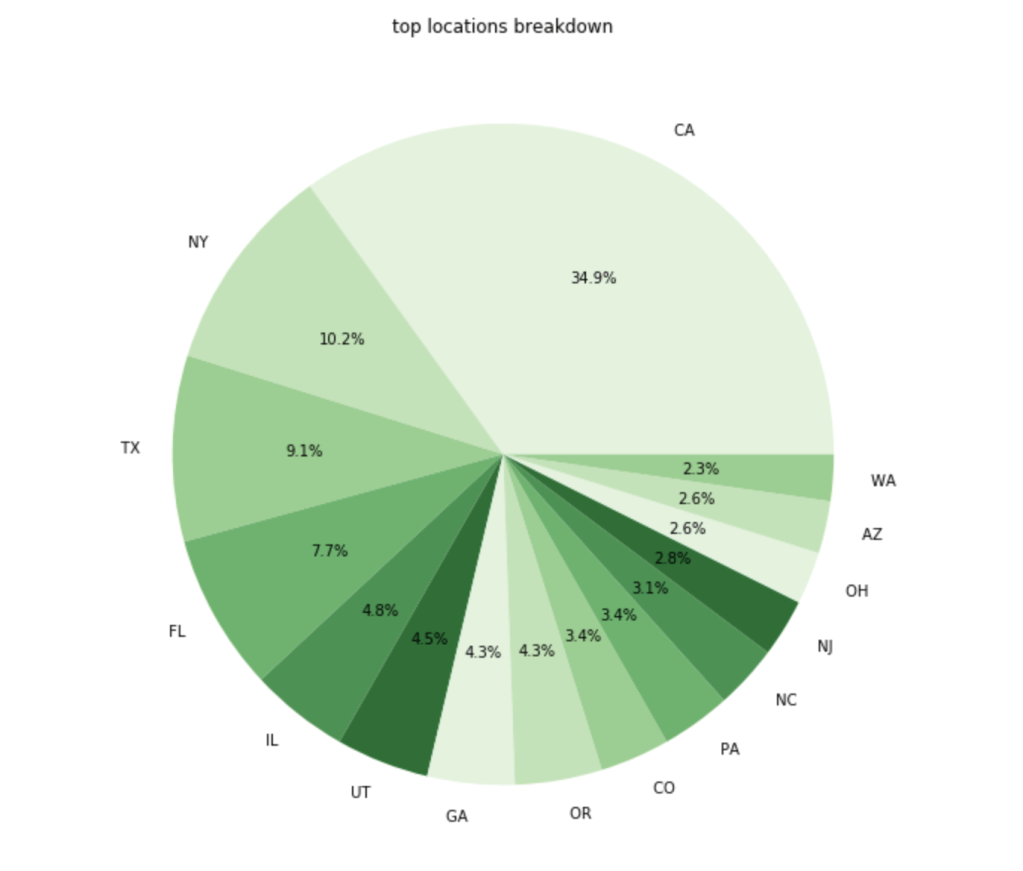
Here is a breakdown of where the most common entrepreneurs come from:
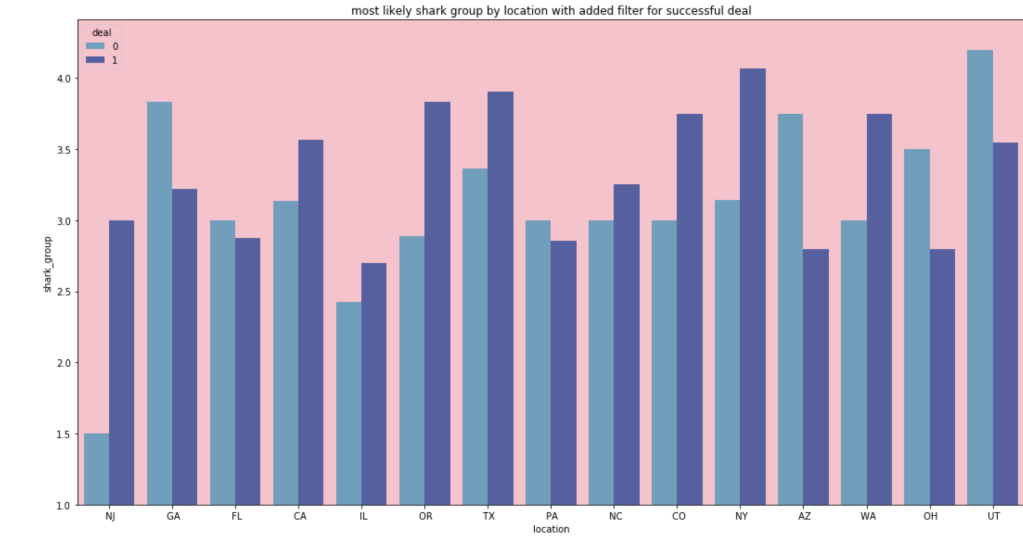
In terms of the most likely shark group for people from different locations:
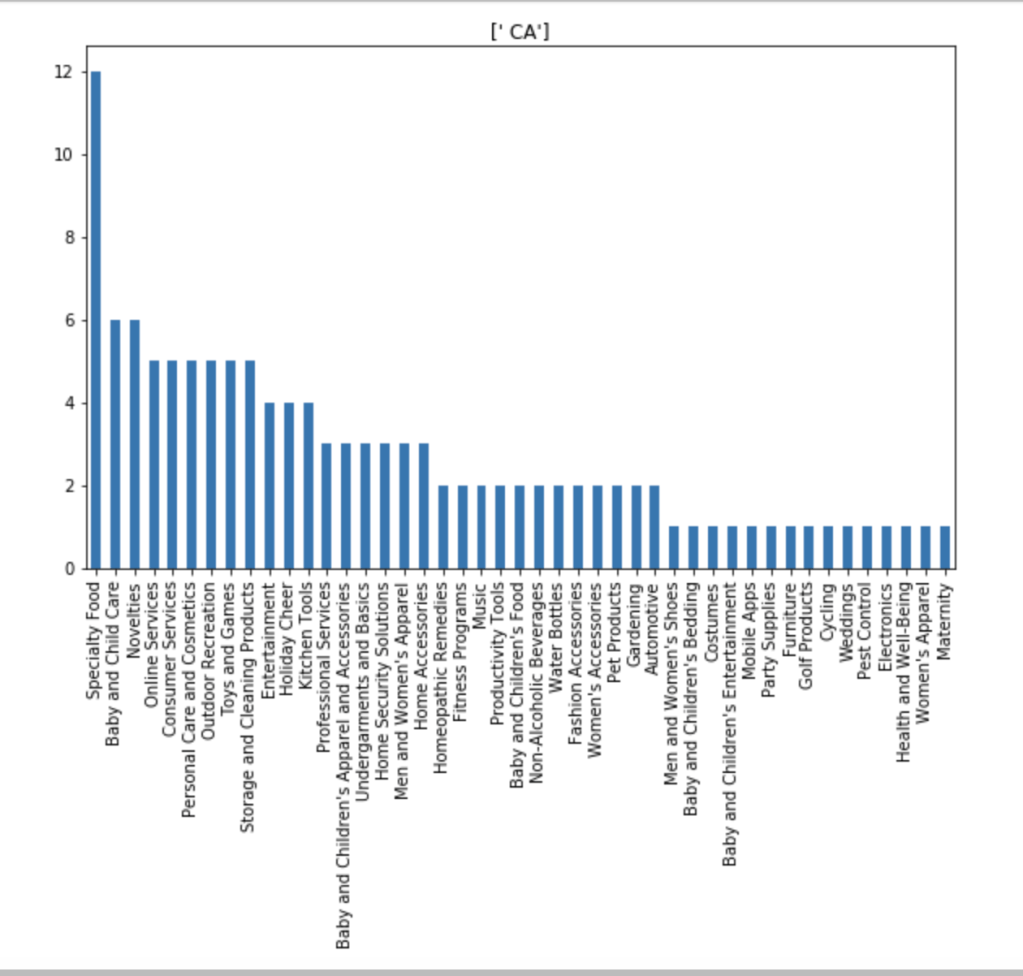
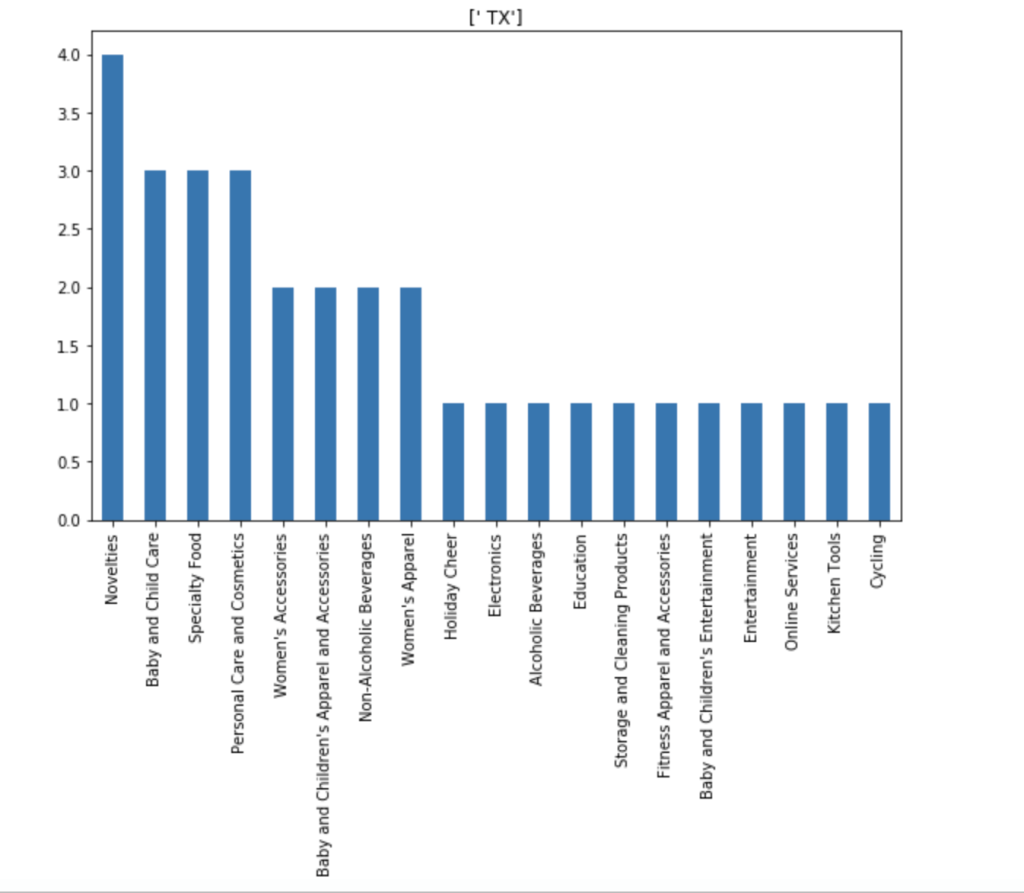
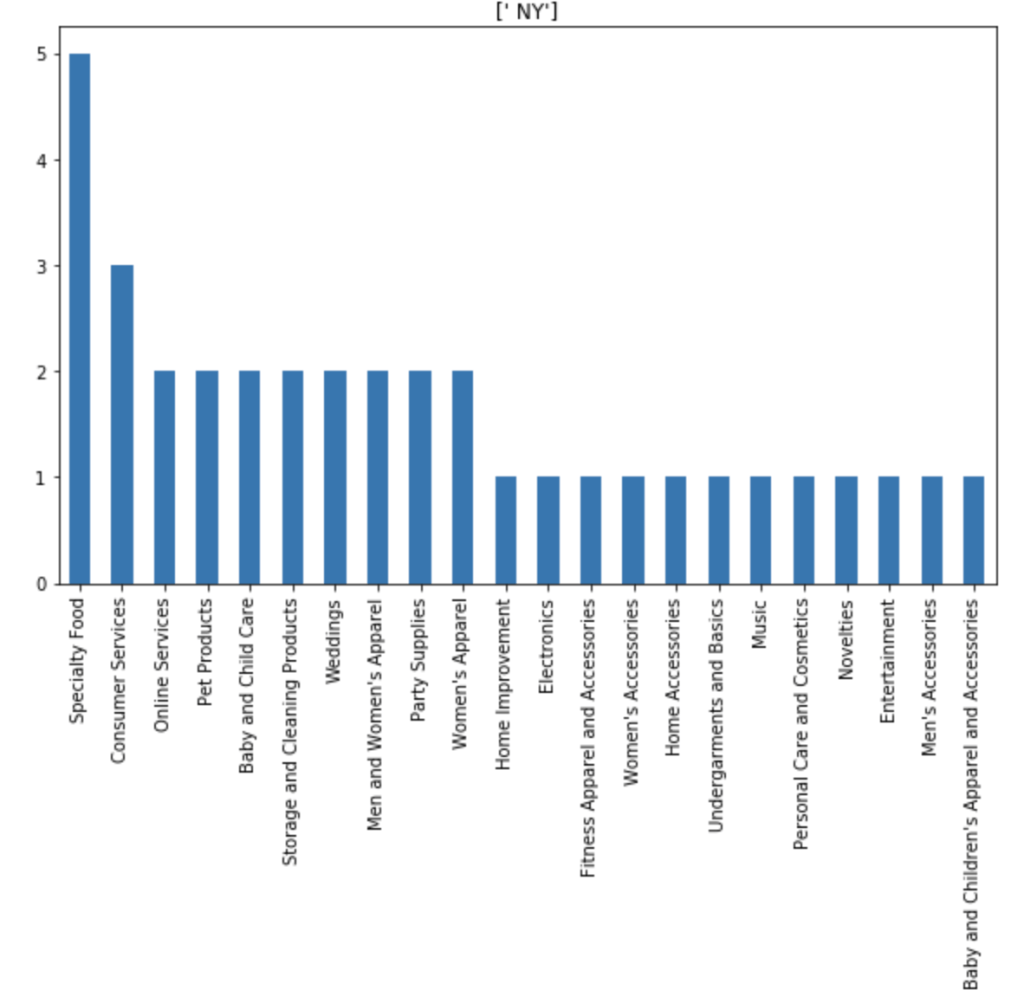
I also made some visuals of the amount of appearances of each unique category by each of the 50 states. We obviously won’t go through every state. Here are a couple, though:
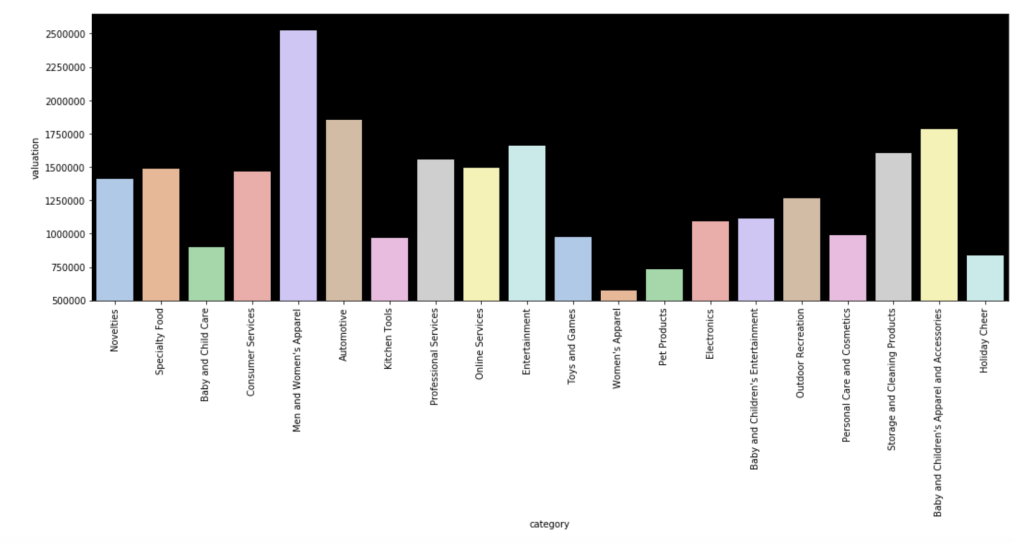
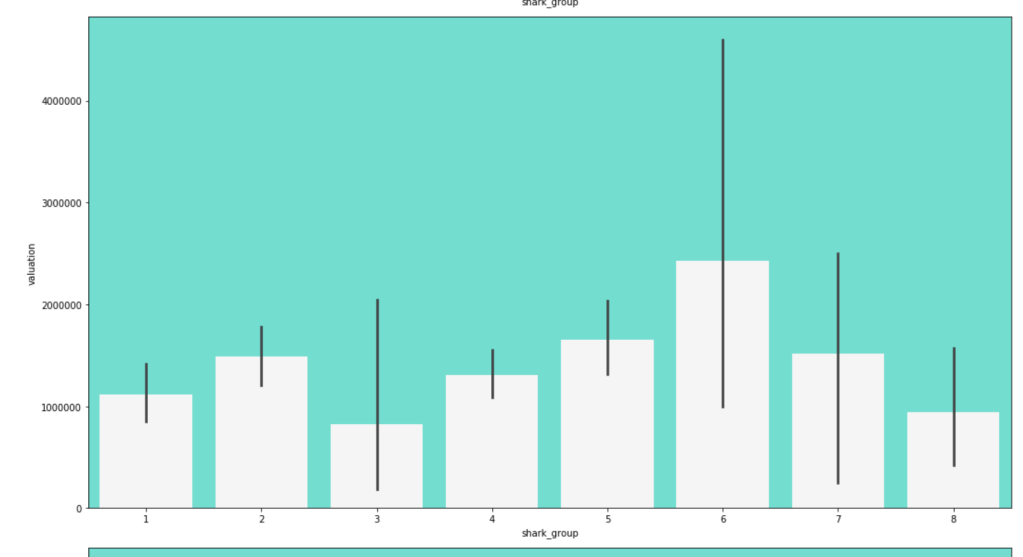
Here is the average valuation by category:
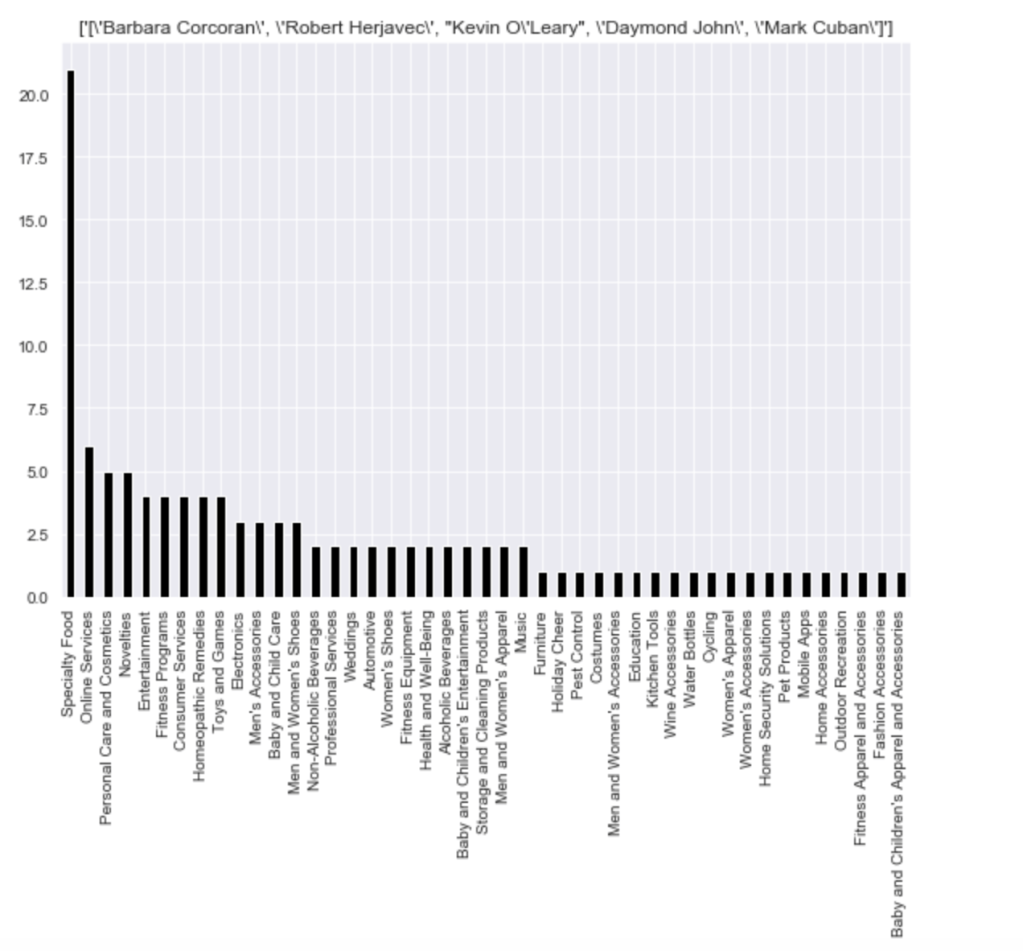
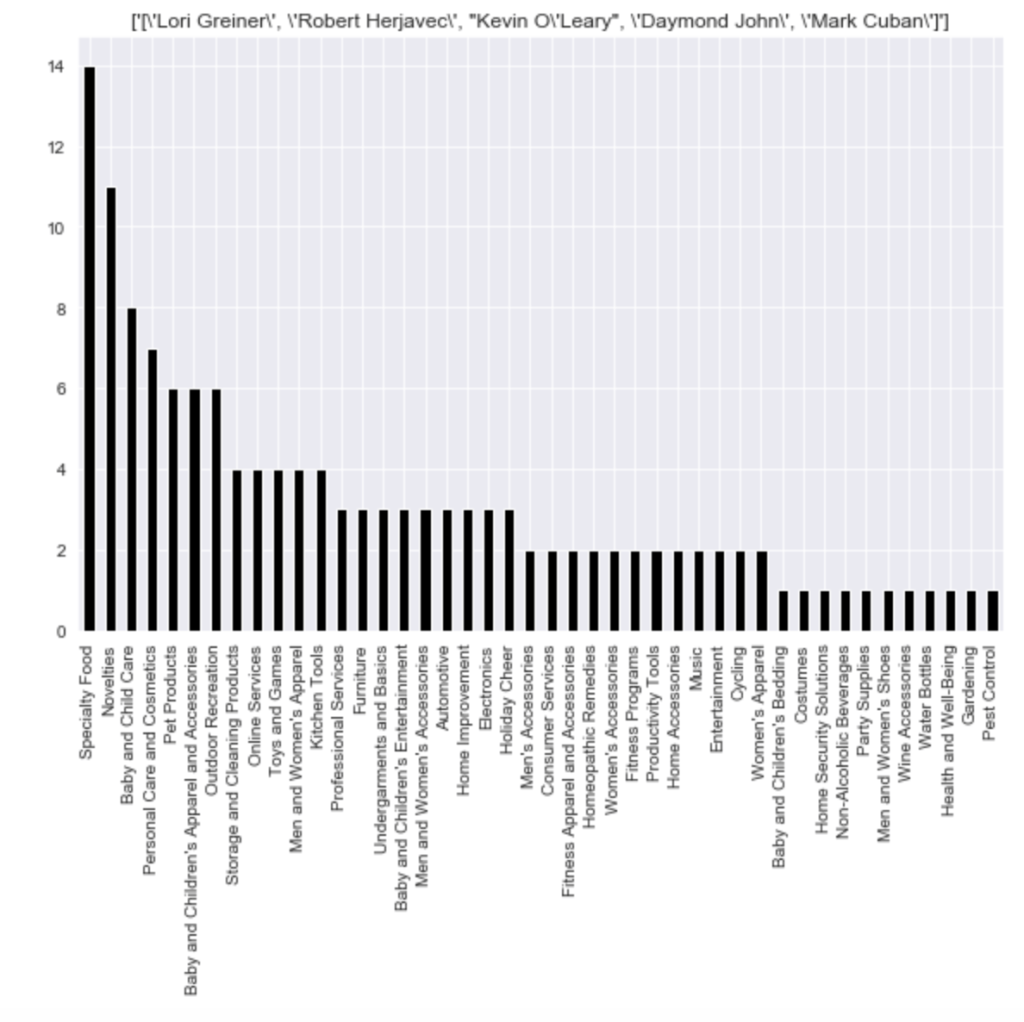
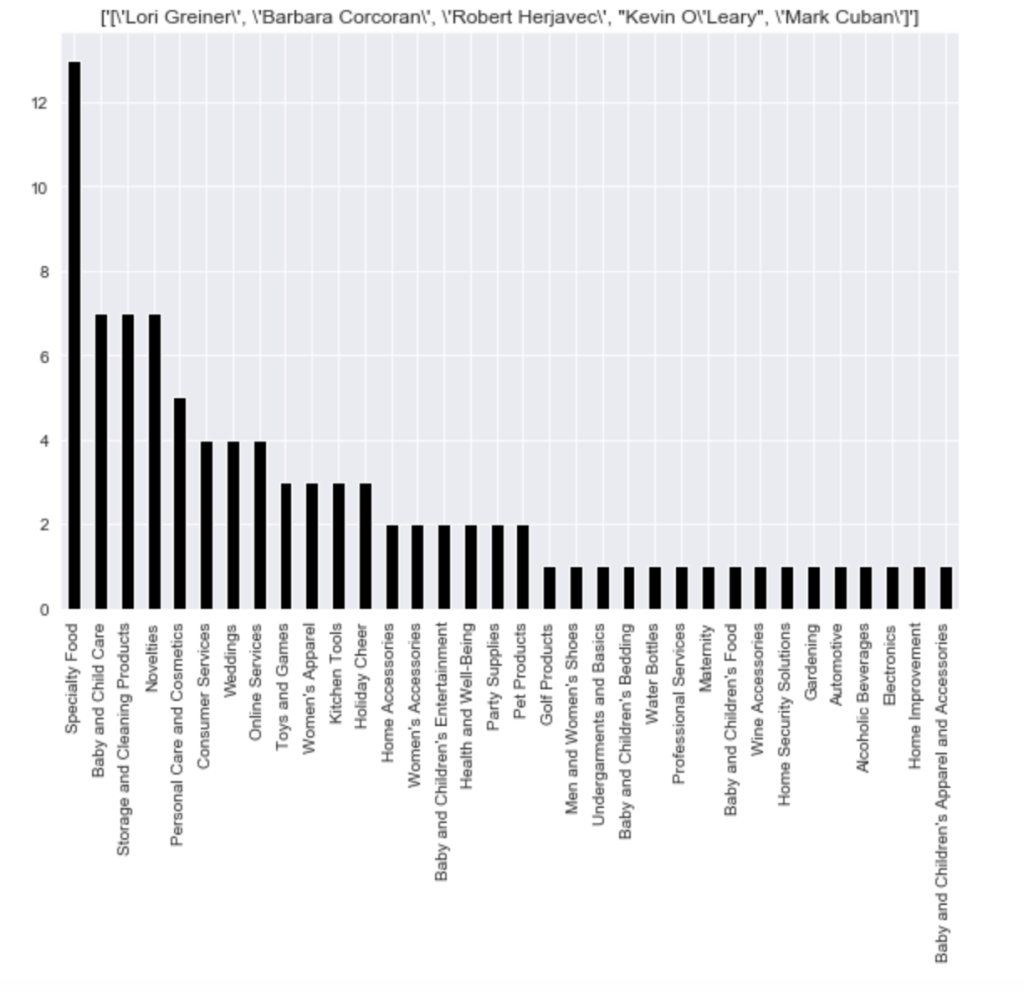
Here is a distribution of pitches to the different shark groups (please ignore the weird formatting):
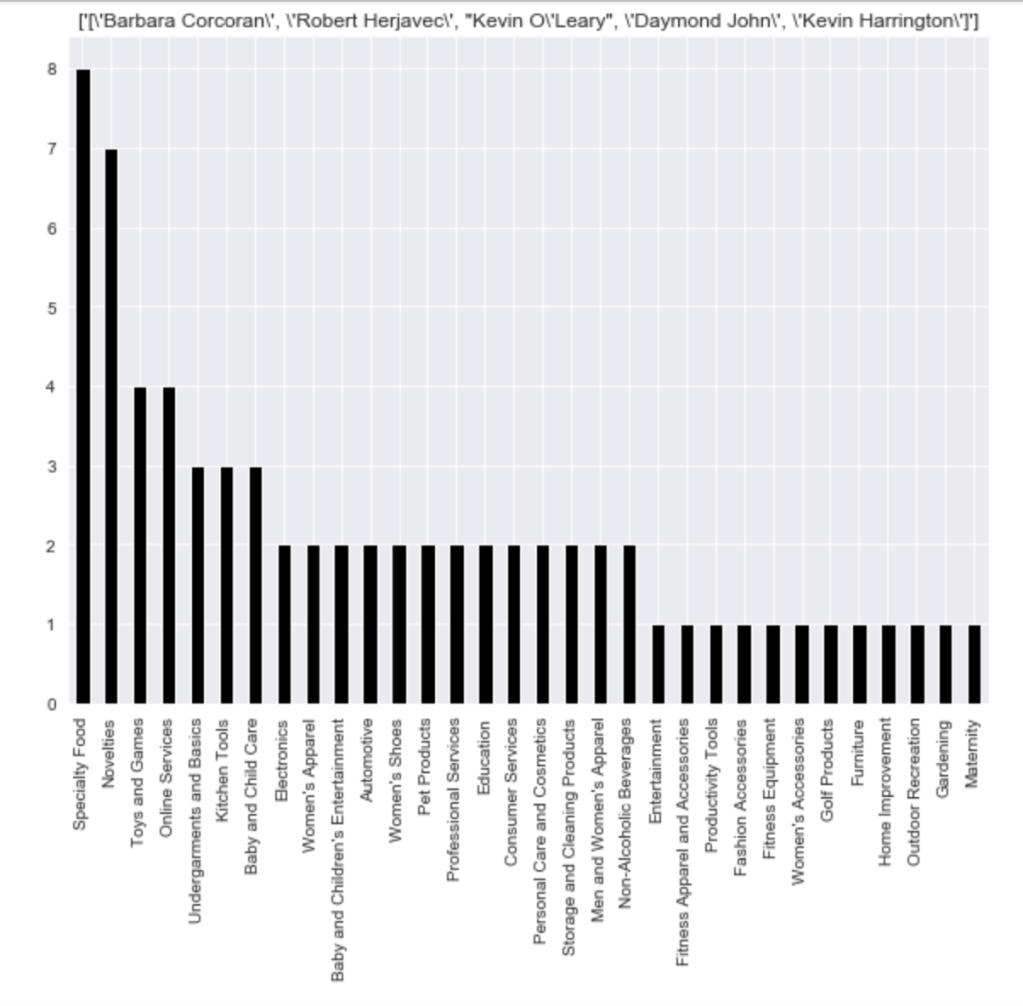
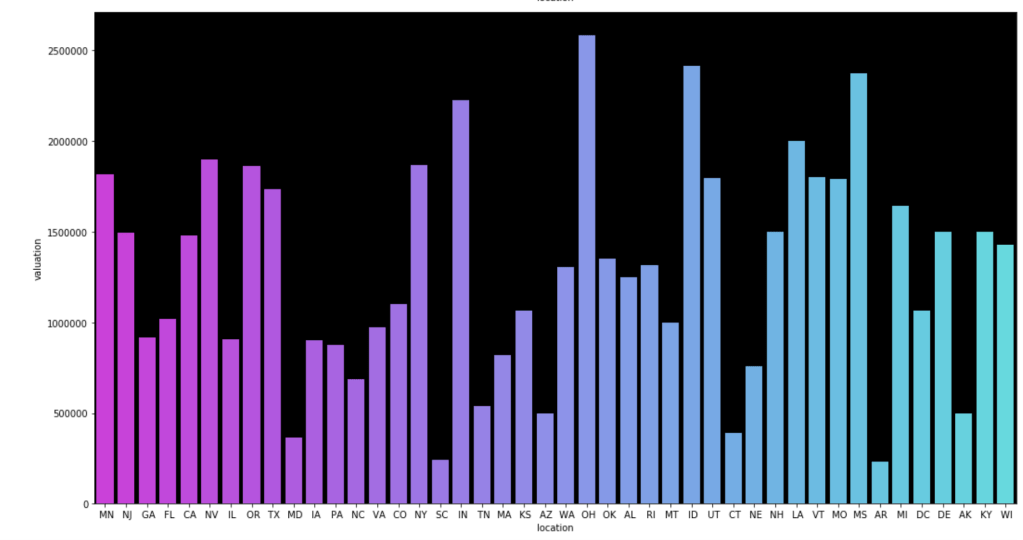
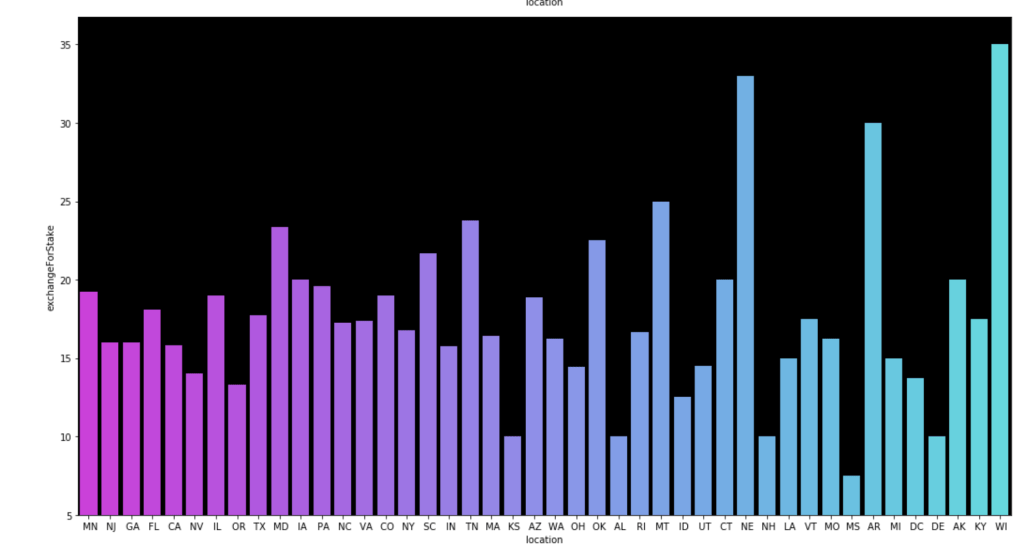
Here come some various visuals related to location:
Here come some various visuals related to shark group
This concludes my EDA for now.
Modeling
After doing some basic data cleaning and feature engineering, it’s time to see if I can actually build a good model.
First Model
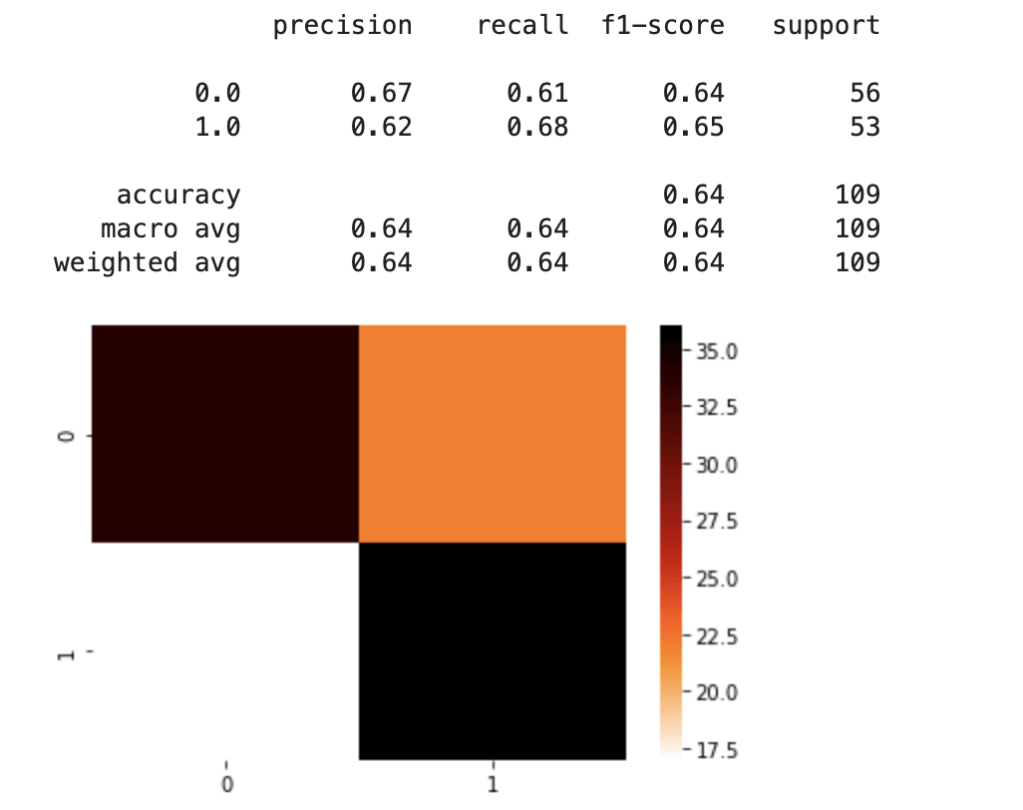
For my first model, I used dummy variables for the “category” feature and information on sharks. Due to the problem of having different instances of the category feature, I split my data into a training and test set after pre-processing the data. I mixed and matched a couple of scaling methods and machine learning classification models before landing on standard scaling and logistic regression. Here was my first set of results:
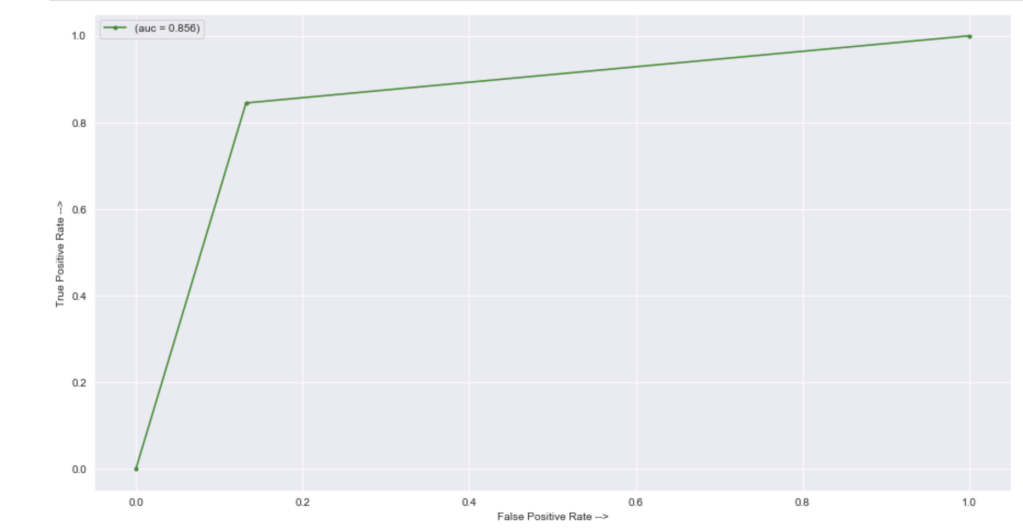
In terms of an ROC/AUC visual:
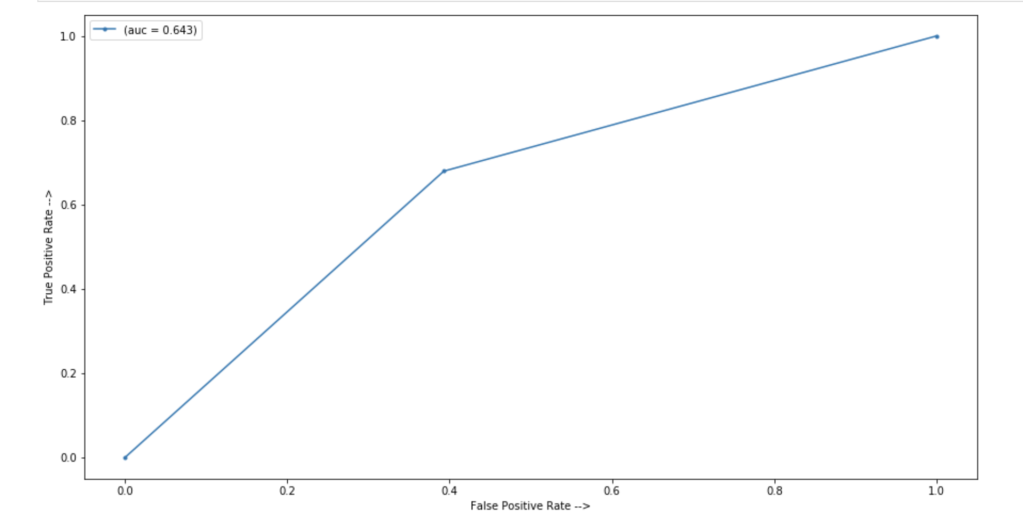
64% accuracy on a show where anything can happen is a great start. Here were my coefficients in terms of a visual:
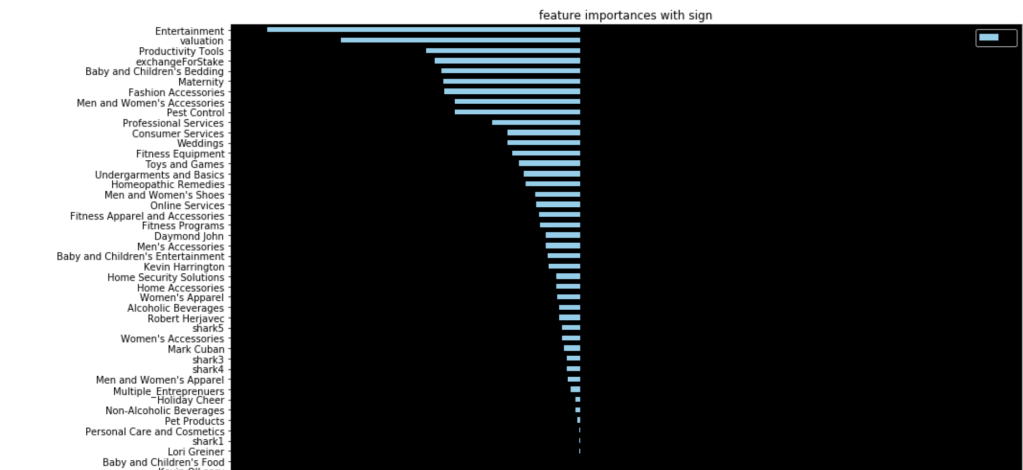
Let’s talk about these results. It seems like having Barbara Corcoran as a shark is the most likely indicator of a potential deal. That doesn’t mean Barbara makes the most deals. Rather, it means that you are likely to get a deal from someone if Barbara happens to be present. I really like Kevin because he always makes a ridiculous offer centered around royalties. His coefficient sits around zero. Effectively, if Kevin is there, we have no idea whether or not there will be a deal. He contributes nothing to my model. (He may as well be dead to me). Location seems to be an important decider. I interpret this to mean that some locations appear very infrequently and just happened to strike a deal. Furniture, music, and home improvement seem to be the most successful types of pitches. I’ll let you take a look for yourself to gain further insights.
Second Model
For my second model, I leveraged target encoding for all categorical data. This allowed me to split up my data before any preprocessing. I also spent time writing a complex backend helper module to automate my notebook. Here’s what my notebook looked like after all that work:
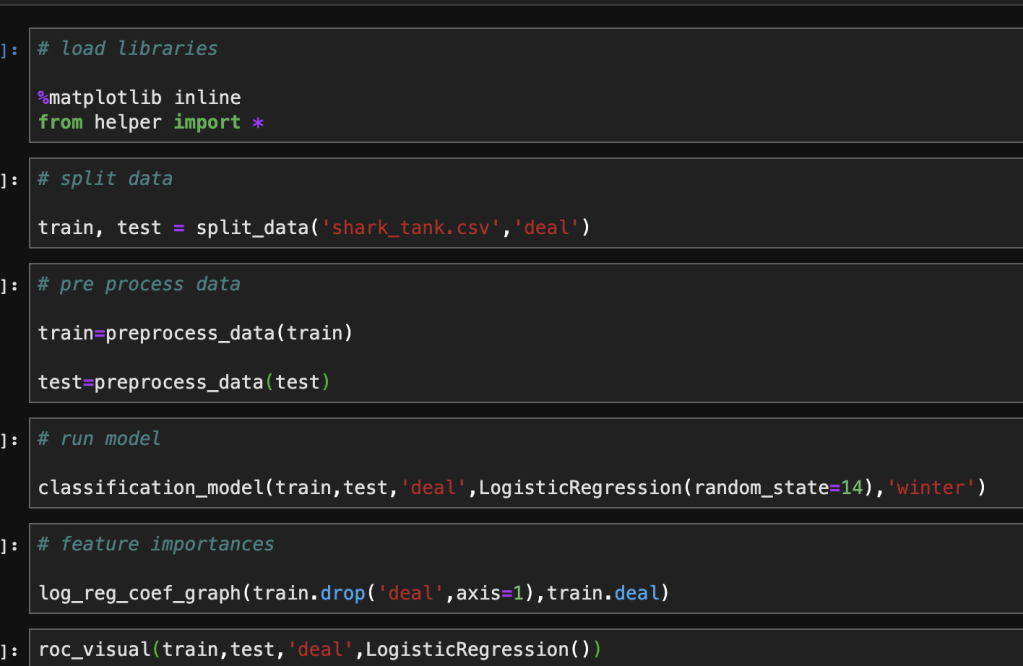
That was fast. Let’s see how well this new model performed given the new method used in feature engineering:
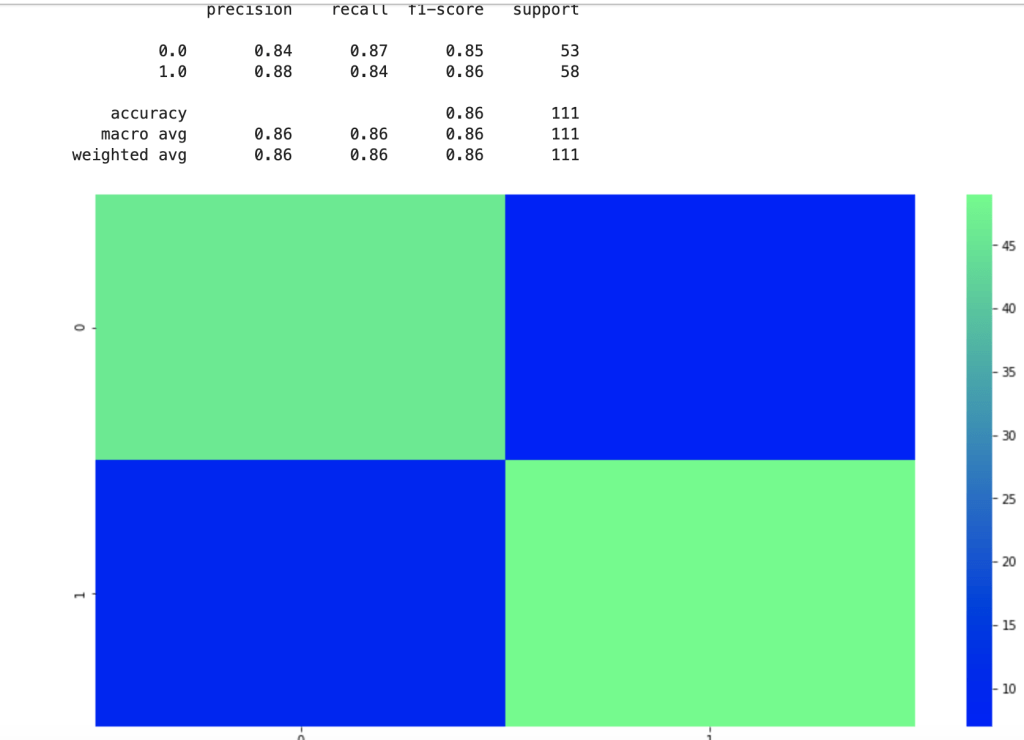
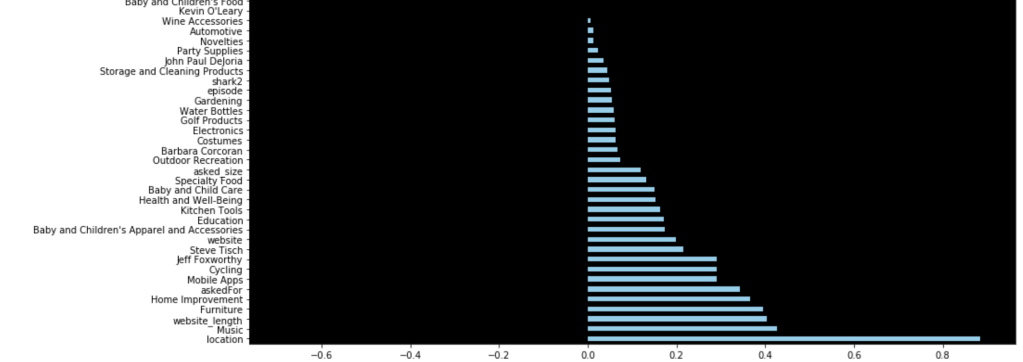
There is clearly a sharp and meaningful improvement present. That said, by using target encoding, I can no longer see the effects of individual categories pitched or sharks present. Here were my new coefficients:
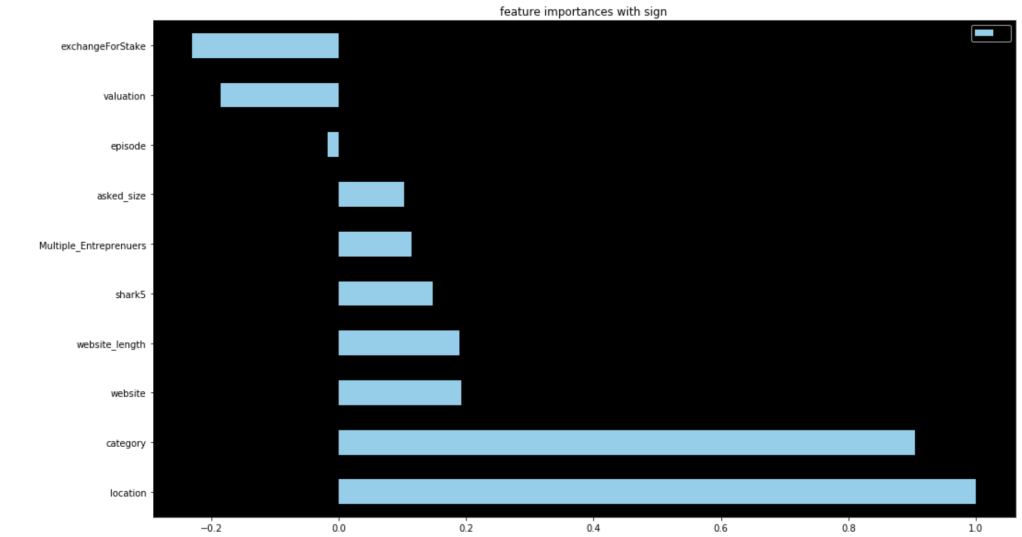
These are a lot less coefficients than in my previous model due to the dummy variable problem, but this led to higher scores. This second model really shocked me. 86% accuracy for predicting the success of a shark tank pitch really surprised me given all the variability present in the show.
Conclusion
I was really glad that my first model was 64% accurate given what the show is like and all the variability involved. I came away with some insightful coefficients to understand what drove predictions. By sacrificing some detailed information I kept with dummy variables, I was able to encode categorical data in a different way which led to an even more accurate model. I’m excited to continue this project and add more data from more recent episodes to continue to build a more meaningful model.
Thanks for reading and I hope this was fun for any Shark Tank fans out there.
Anyway, this is the end of my blog…